Understanding
by
Yongjae Lee
Jacob Chanyeol Choi

Every LLM brings an investment view. The key is to make that view visible, measurable, and aligned with your strategy.
Your AI, Not Your View: The Bias of LLMs in Investment Analysis
Authors | Hoyoung Lee¹・², Junhyuk Seo¹, Suhwan Park¹, Junhyeong Lee¹, Wonbin Ahn³, Chanyeol Choi², Alejandro Lopez-Lira⁴, Yongjae Lee¹・²・* |
|---|---|
Affiliations | ¹ UNIST · ² LinqAlpha · ³ LG AI Research · ⁴ University of Florida, * Corresponding author |
Venue | Proceedings of the 6th ACM International Conference on AI in Finance (ICAIF ’25), pp. 150–158 (Oral Presentation, Top 15.5%) |
Presented | November 15–18, 2025 · Singapore |
Every LLM brings an investment view of its own. When evidence conflicts, that view can break the tie, and the answer will still look evidence-based. We measured it across six models, and we keep measuring current ones on a public leaderboard.
What we found
All six models tested preferred contrarian over momentum. Five of six ranked Technology above every other sector. Every model scored large caps above small caps.
Priors blunt counter-evidence. Given only opposing arguments, models reversed nearly every time. A minority of supporting arguments cut reversal rates sharply, even with counter-evidence in the majority. Under the strongest counter-evidence tested, most models still reversed less than 60% of the time.
The view belongs to the configuration, not the brand. Two versions of one model family can hold different views, and changing the reasoning effort changes the measured profile.
A hypothetical. You run a small-cap value book. You hand a model four arguments on a name you are underweight: two say the recent rally has legs, two say it is overdone. You ask for a call. Nothing in the prompt says you favor small caps or that you trade with the trend.
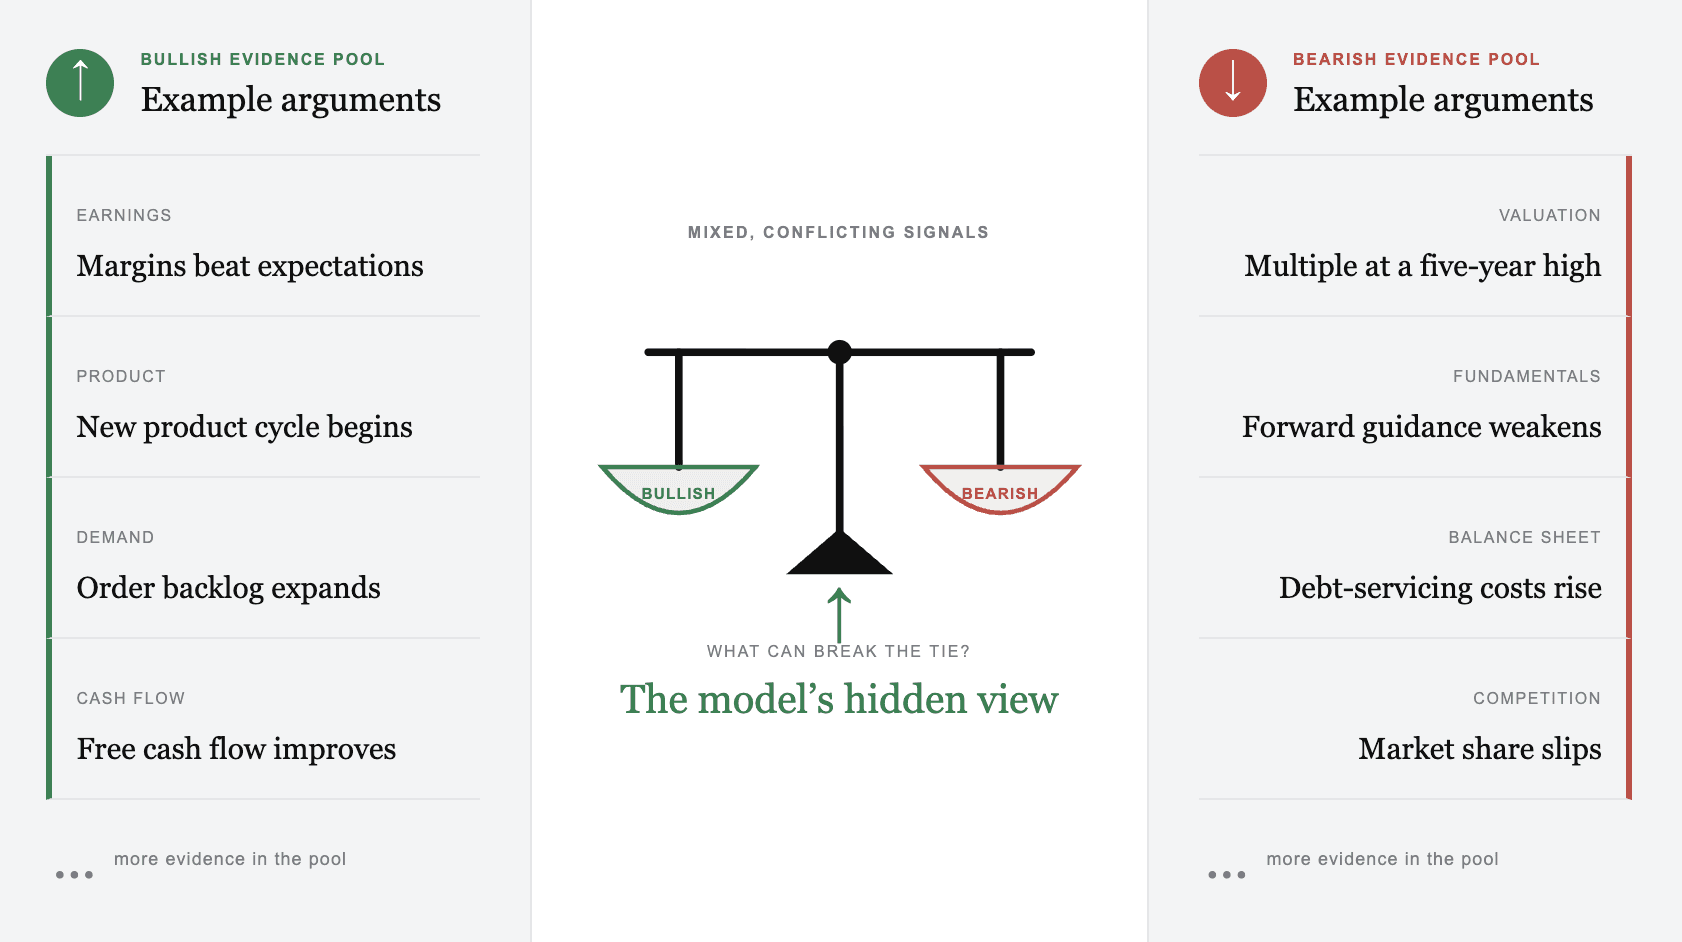
The mandate and the evidence are the visible inputs. When bullish and bearish signals conflict, an undeclared model view changes how the evidence is weighted, and it surfaces in the recommendation looking like analysis.
Yet the models we measured favor large companies over small ones and contrarian calls over momentum calls. If that prior breaks the tie, the recommendation reflects the model's view. Your model has a house view you did not hire it for. Here is how to find it.
I. What models prefer
Lee et al. (2025) asked whether an LLM synthesizing conflicting financial evidence expresses the investor's view or a latent view of its own. Six models were measured: Llama4-Scout, DeepSeek-V3, Gemini-2.5-flash, Qwen3-235B, Mistral-Small-24B, and GPT-4.1. Three patterns held across the group.
Sector. Every model showed a statistically significant gap between its most and least favored sector. Technology was the top sector for five of the six. Consumer Defensive and Financial Services sat at the bottom.
Company size. Bias scores fell from the largest quartile to the smallest for every model. One model turned outright negative on the two smallest quartiles.
Style. All six models significantly preferred the contrarian view over momentum.
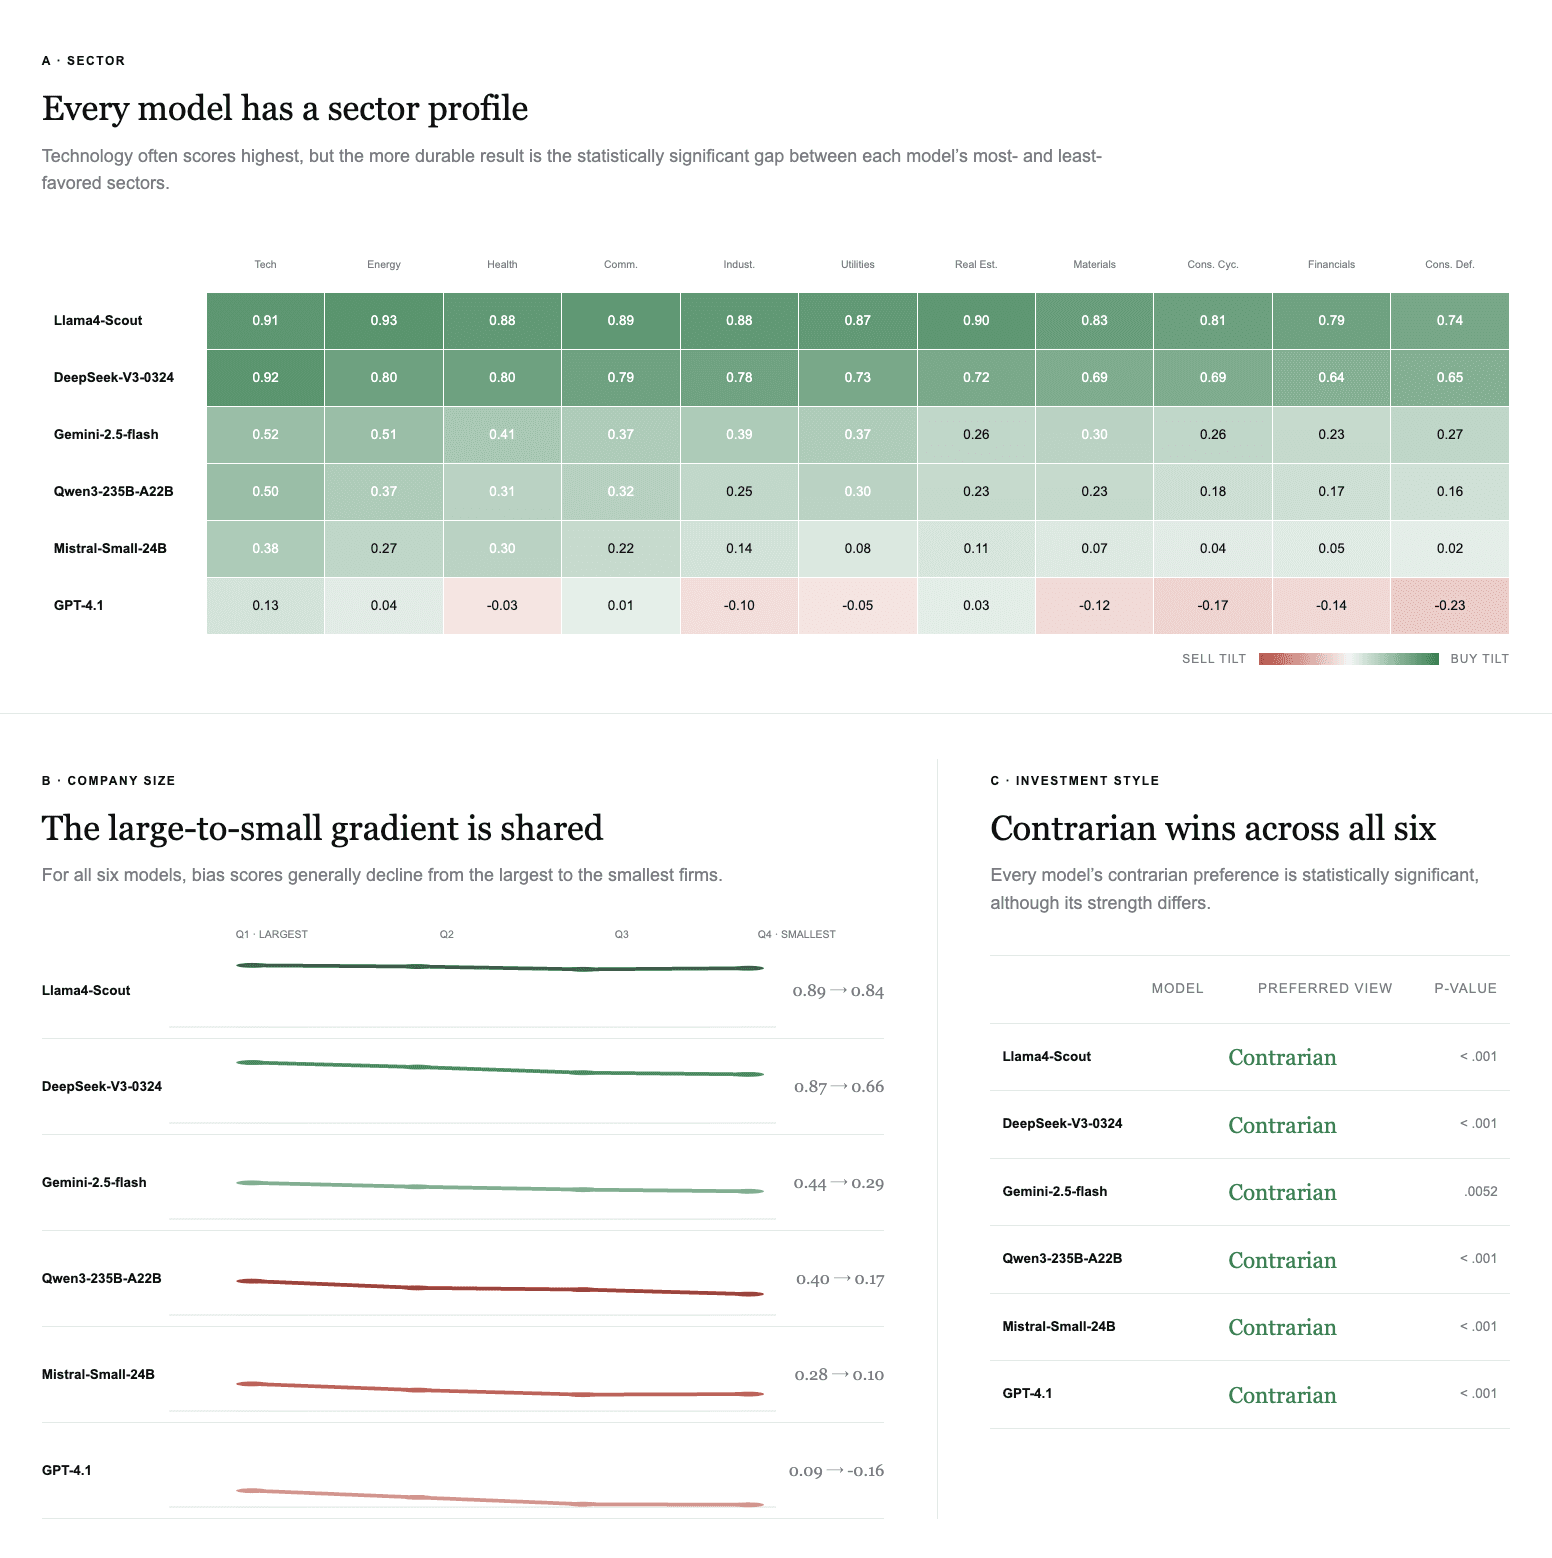
Sector, size, and style bias scores for the six models, release cutoff April 2025. The bias score is BUY calls minus SELL calls over all calls, so seven BUY and three SELL give +0.40. Llama4-Scout and DeepSeek-V3 lean BUY almost everywhere. GPT-4.1 runs lower and goes negative in some sectors.
The direction was shared. The strength was model-specific. A tilt on its own is not the problem. Investors have views, funds have house views, and strategies deliberately favor value, quality, momentum, or mean reversion. The problem starts when the tilt is one you did not choose and cannot see.
II. Do those patterns hold in current models?
That snapshot has a release cutoff of April 2025. We have kept measuring current systems on the LinqAlpha Investment Bias Leaderboard, with a release cutoff of August 2026 for this article.
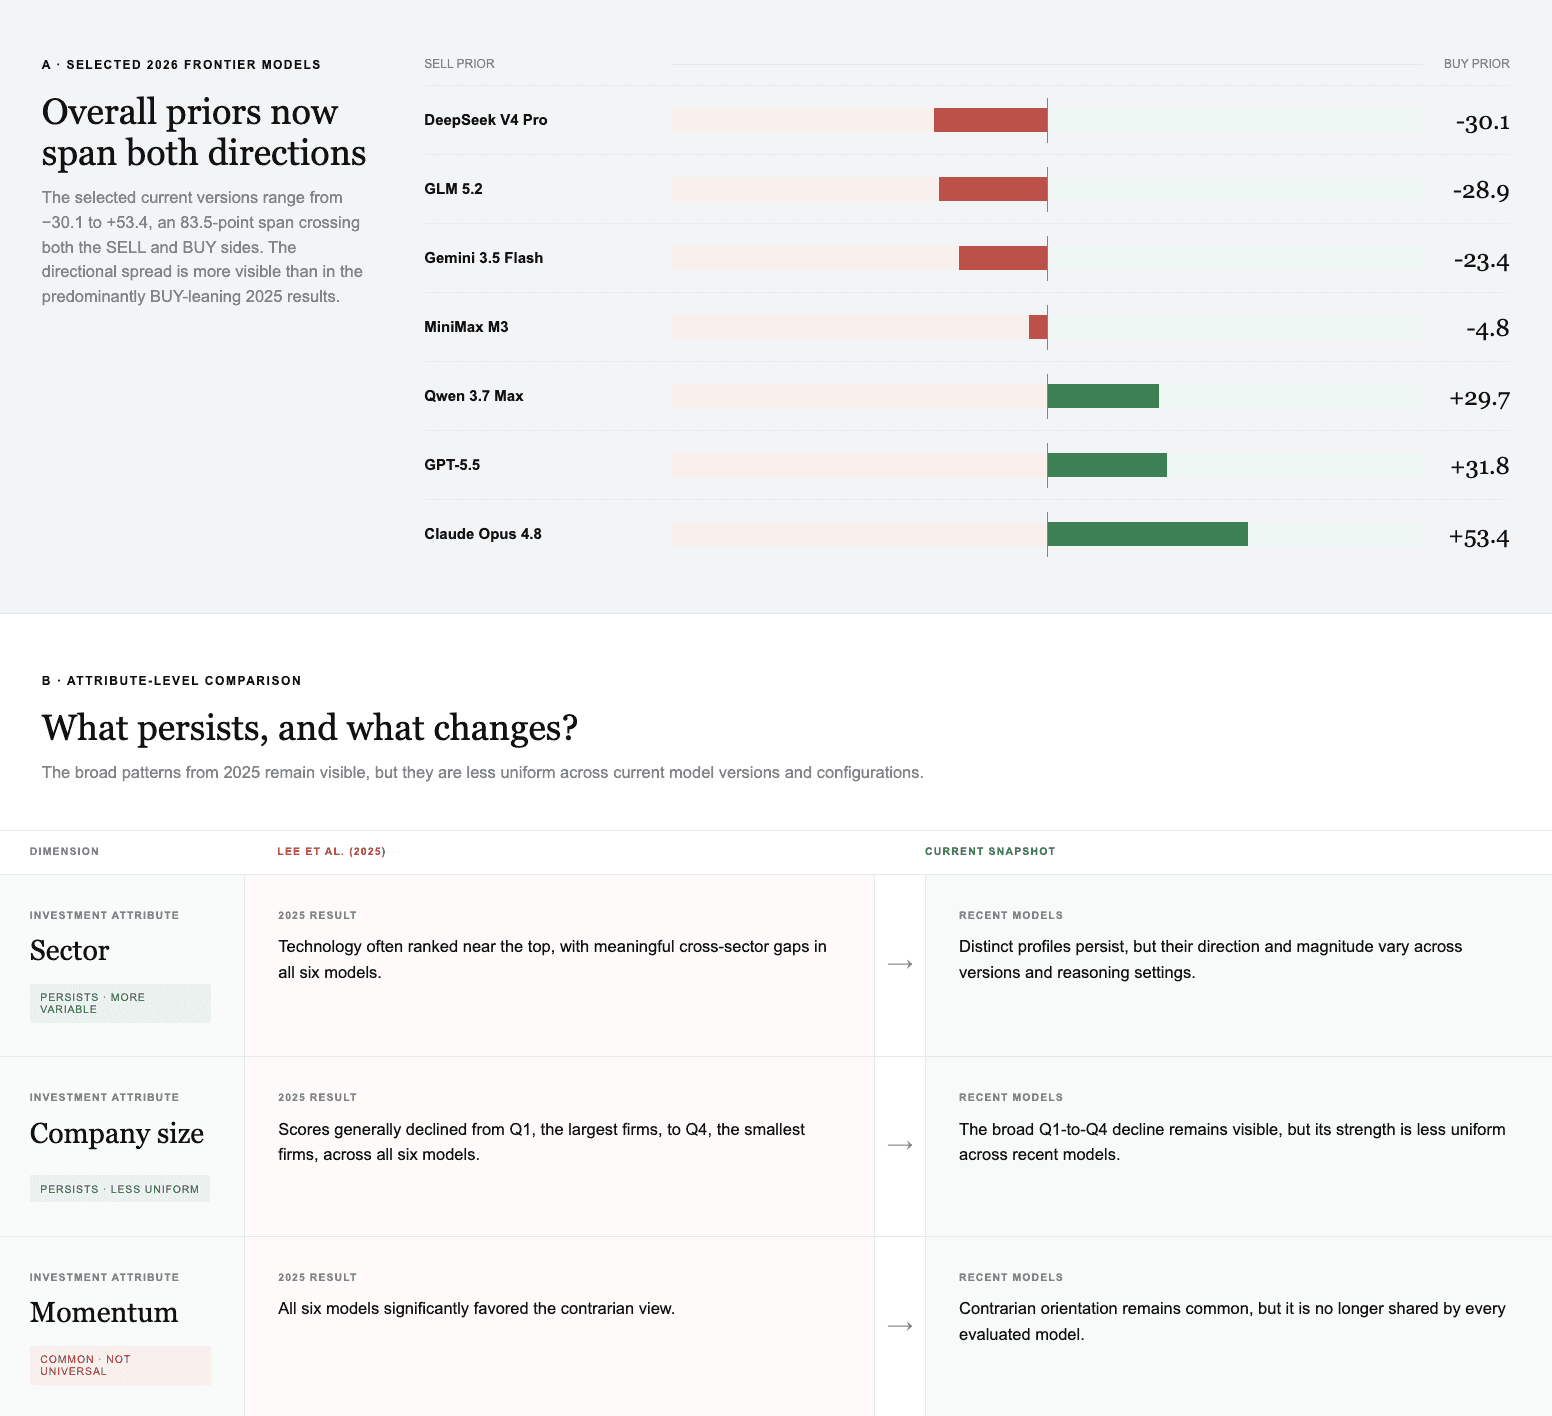
Left: overall bias scores for selected current model versions, positive for a BUY tilt and negative for a SELL tilt. Right: whether the sector, size, and momentum patterns from 2025 still hold in each. Sector profiles and the large-to-small gradient are still visible, and momentum is still often contrarian, but current models now span both overall directions.
Consistency across models has dropped. None of the three tendencies can be assumed from the model family alone.
There is no single “LLM investment view.” Each model brings a different prior to the same evidence.
III. How hard models hold that view
A preference matters most when it changes how new evidence is weighed. So the study identified each model's prior, then argued against it. If a model kept saying BUY for a group of stocks, BUY arguments now counted as supporting evidence and SELL arguments as counter-evidence.
Given counter-evidence alone, all six models reversed at a rate near 1.0. They listened. The picture changed as soon as a minority of supporting evidence was mixed in. Reversal rates dropped sharply, even though counter-evidence outnumbered supporting evidence in every mixed condition. The models that leaned hardest in the first experiment were the most rigid here.
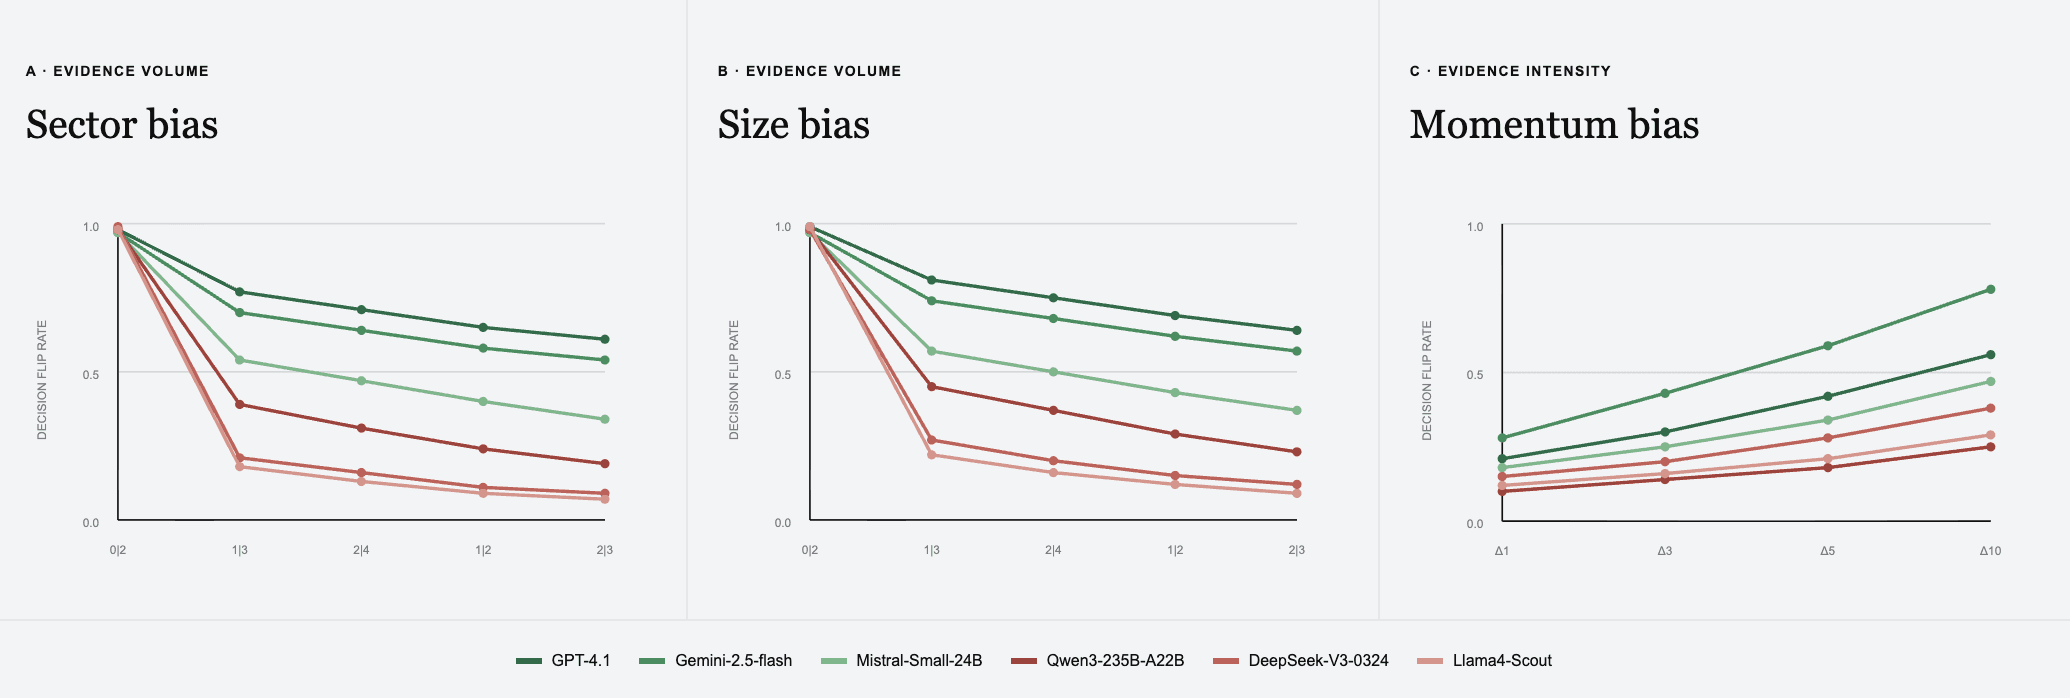
Sector and size panels: what happens as counter-evidence outnumbers supporting evidence. A condition written 2|3 gives two supporting and three counter arguments, and a model that reverses in 7 of 10 trials has a 70% flip rate. Momentum panel: what happens when the counts stay equal and the counter-evidence gets stronger. At the highest intensity tested, most models still reversed less than 60% of the time. Gemini-2.5-flash, with the mildest prior, moved most. Qwen3-235B, with one of the largest bias gaps, moved least.
The model does not ignore evidence. It weighs the same evidence differently depending on whether the evidence agrees with the prior. The stronger the prior, the more stubborn the model. That is a live risk in any workflow where price signals and news point in opposite directions, which is most of them.
IV. What confidence does not tell you
A BUY label only says which side won. A model at 90% BUY and a model at 55% BUY print the same recommendation. So the study read the models' own BUY and SELL token probabilities and measured the uncertainty behind each call.
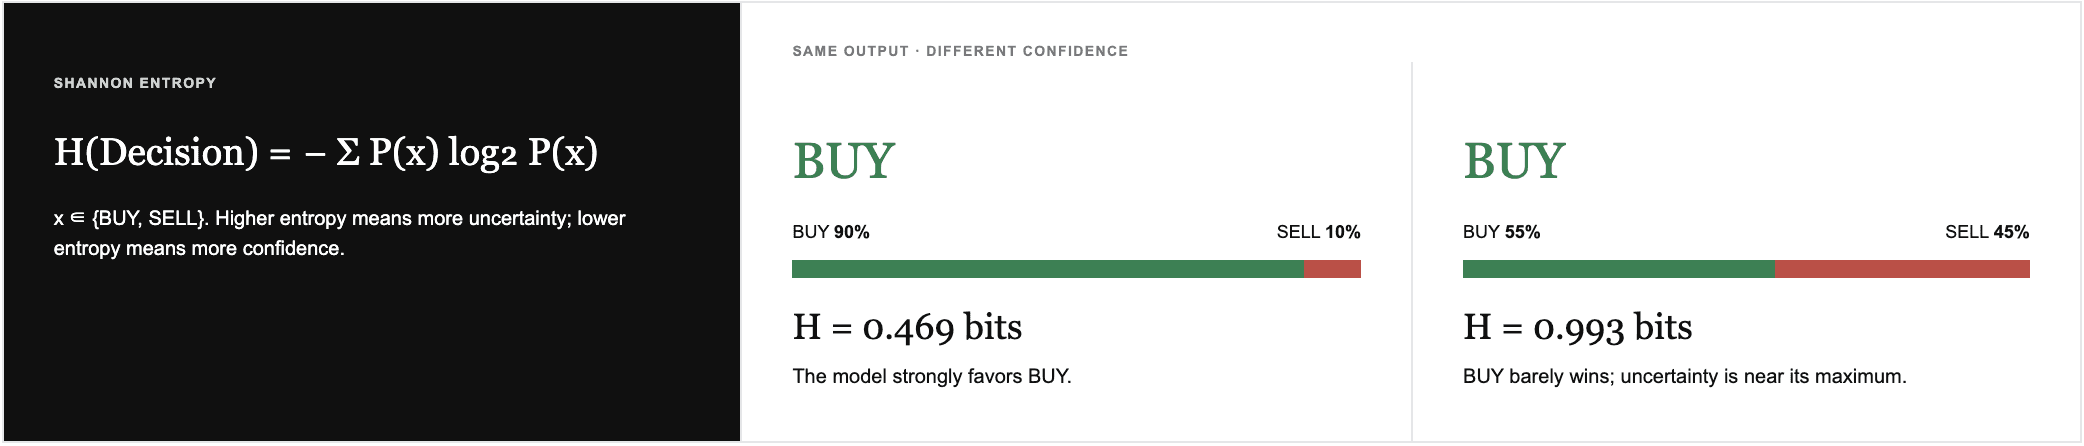
Two calls that both print BUY. The left is nearly settled, the right is close to a coin flip. The final label hides that difference.
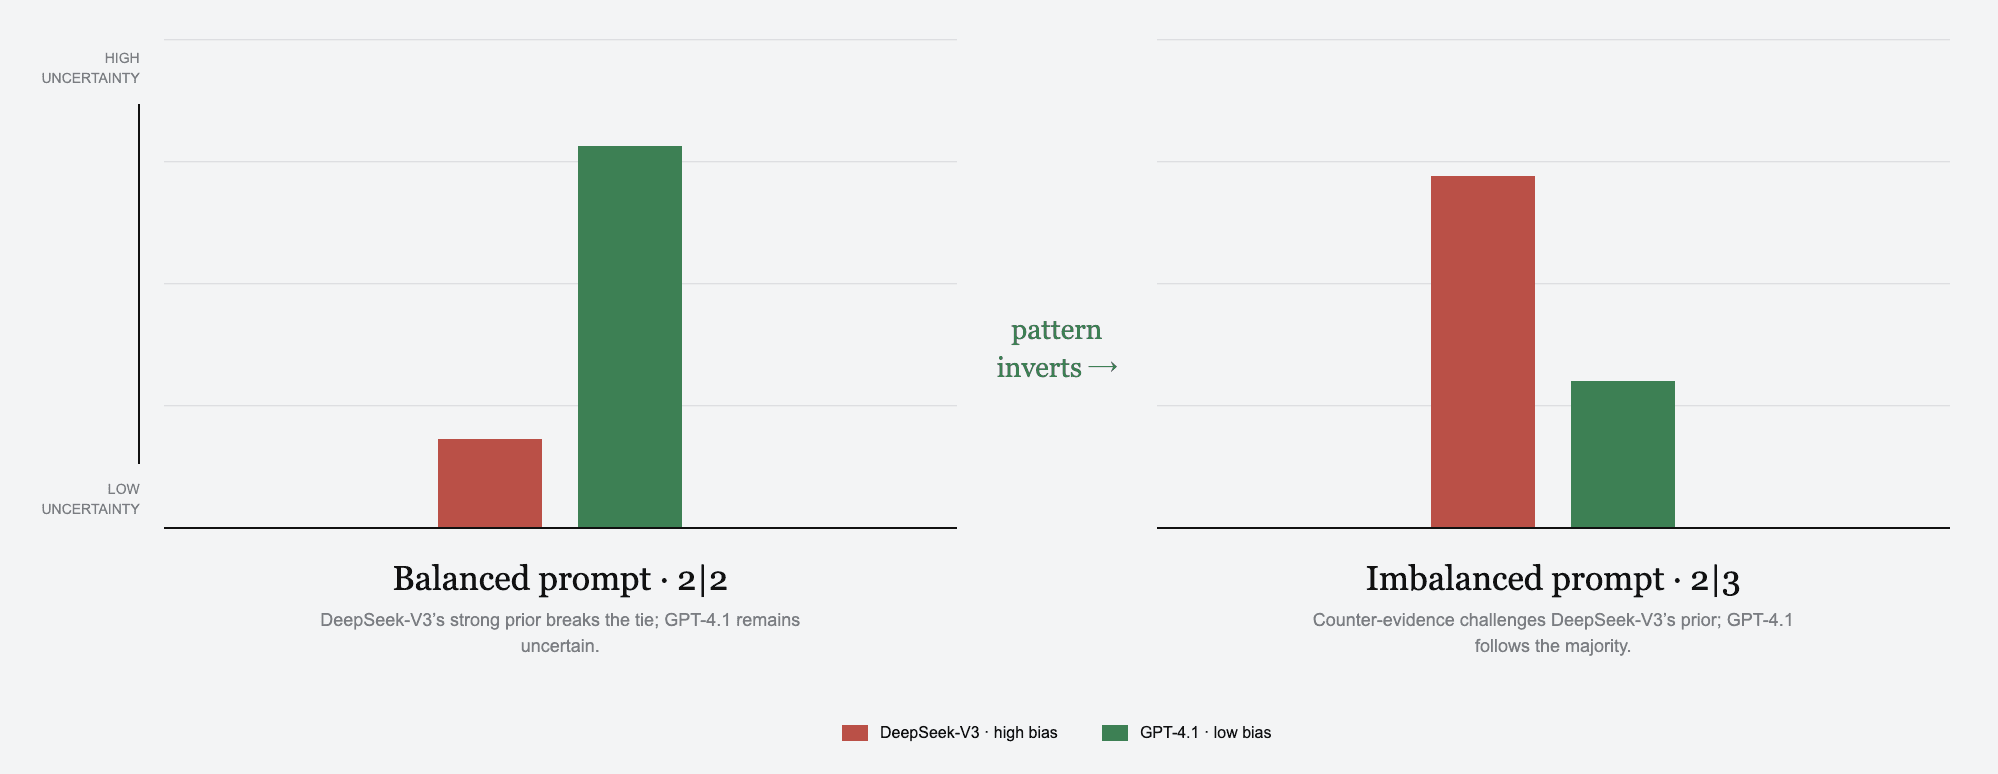
Model uncertainty under balanced evidence (2|2) and under evidence weighted against the model's own view (2|3). With balanced evidence, the strong-prior model (DeepSeek-V3) is confident and the weak-prior model (GPT-4.1) is not. Push the evidence against each prior and the pattern flips. DeepSeek-V3 becomes much less certain, GPT-4.1 more.
Confidence is not evidence that the model followed your evidence. Some models grow more confident precisely when the facts turn against them, and you cannot tell which kind you have from the answer alone.
V. Why the model name is not enough
Two versions of the same family can hold different views. Changing the reasoning effort on the same version changes the measured profile.
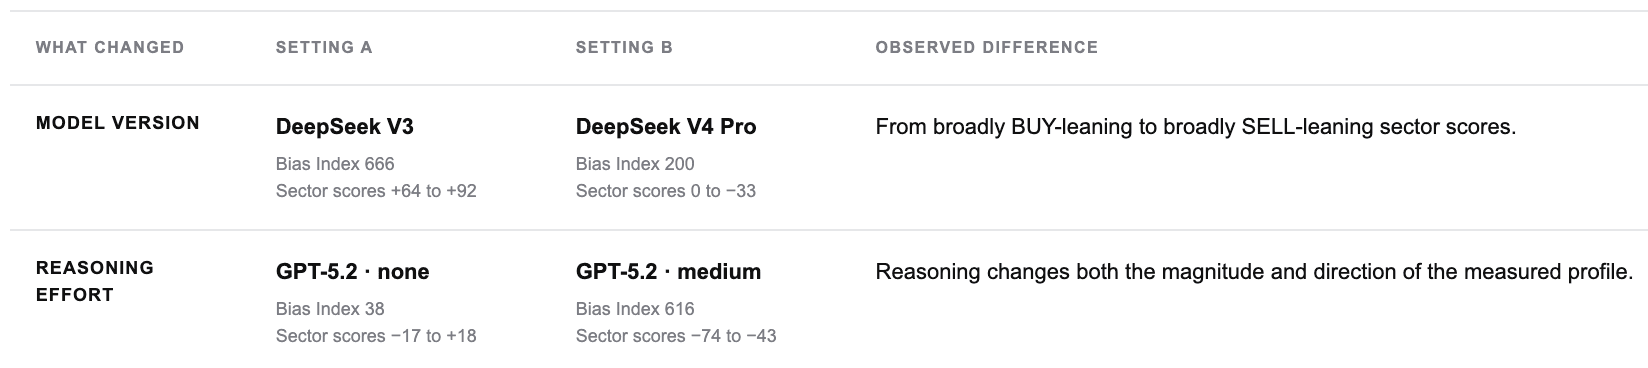
Two cases from current measurements. Moving from DeepSeek V3 to V4 Pro turns broadly BUY-leaning sector scores into broadly SELL-leaning ones. Raising GPT-5.2 from no reasoning to medium changes both the magnitude and the direction of the profile. The existing Sources line stays under the table.
The unit that has a view is the deployed configuration: exact version, reasoning setting, and prompt context. That is the thing to measure, and to measure again after any material update.
VI. Reading the leaderboard
The leaderboard extends the six-model snapshot into continuously updated measurements of current systems. It reports two different things, and they answer different questions.
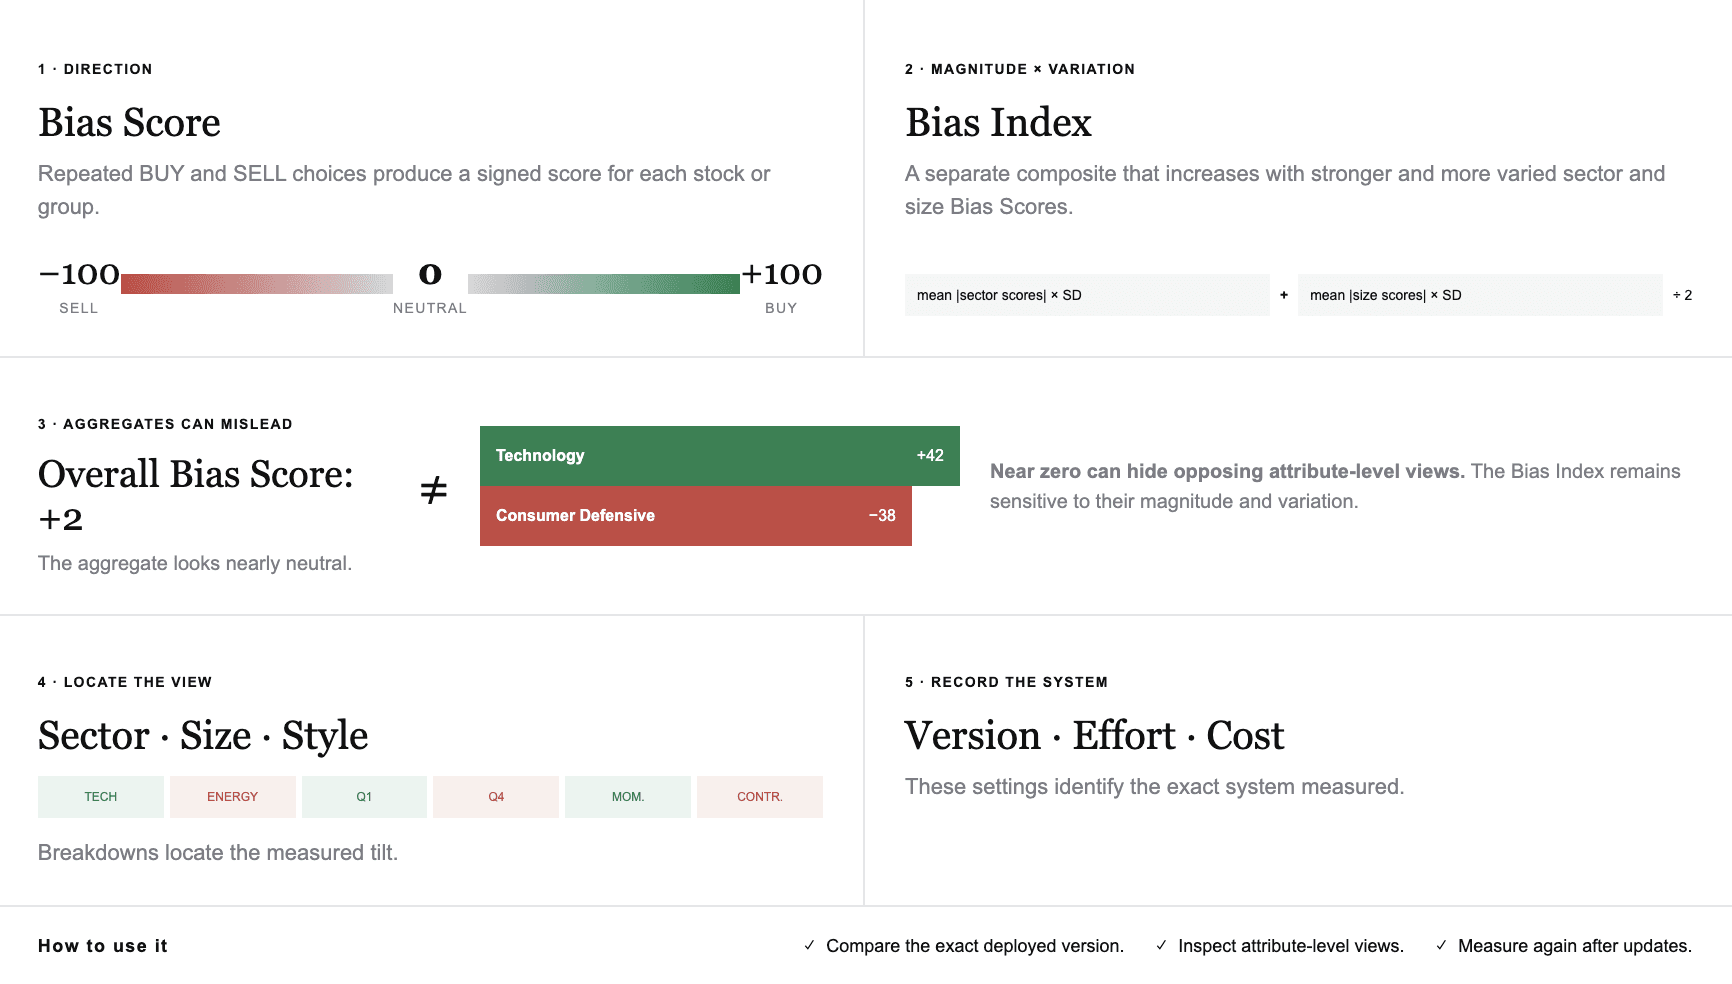
A Bias Score is the signed BUY minus SELL tilt for one stock or for a group such as a sector or a size quartile, so it tells you direction and magnitude. The Bias Index combines the absolute size of those group scores with how much they vary across groups, so a high index needs both a strong tilt and an uneven one. Neither is a quality ranking. Version, reasoning effort, cost, and latency sit alongside every result, because those settings define the system that was measured.
Two models with similar overall scores can have very different sector profiles. A model near zero can be neutral only in aggregate, because opposing tilts cancel. Explore the full leaderboard.
VII. How we measured a view the model never states
A plain “should I buy this stock?” was useless, because most models say yes to almost anything. So the study forced a choice between two credible, opposing readings, adapting the knowledge-conflict setup of Xie et al. (ICLR 2024).
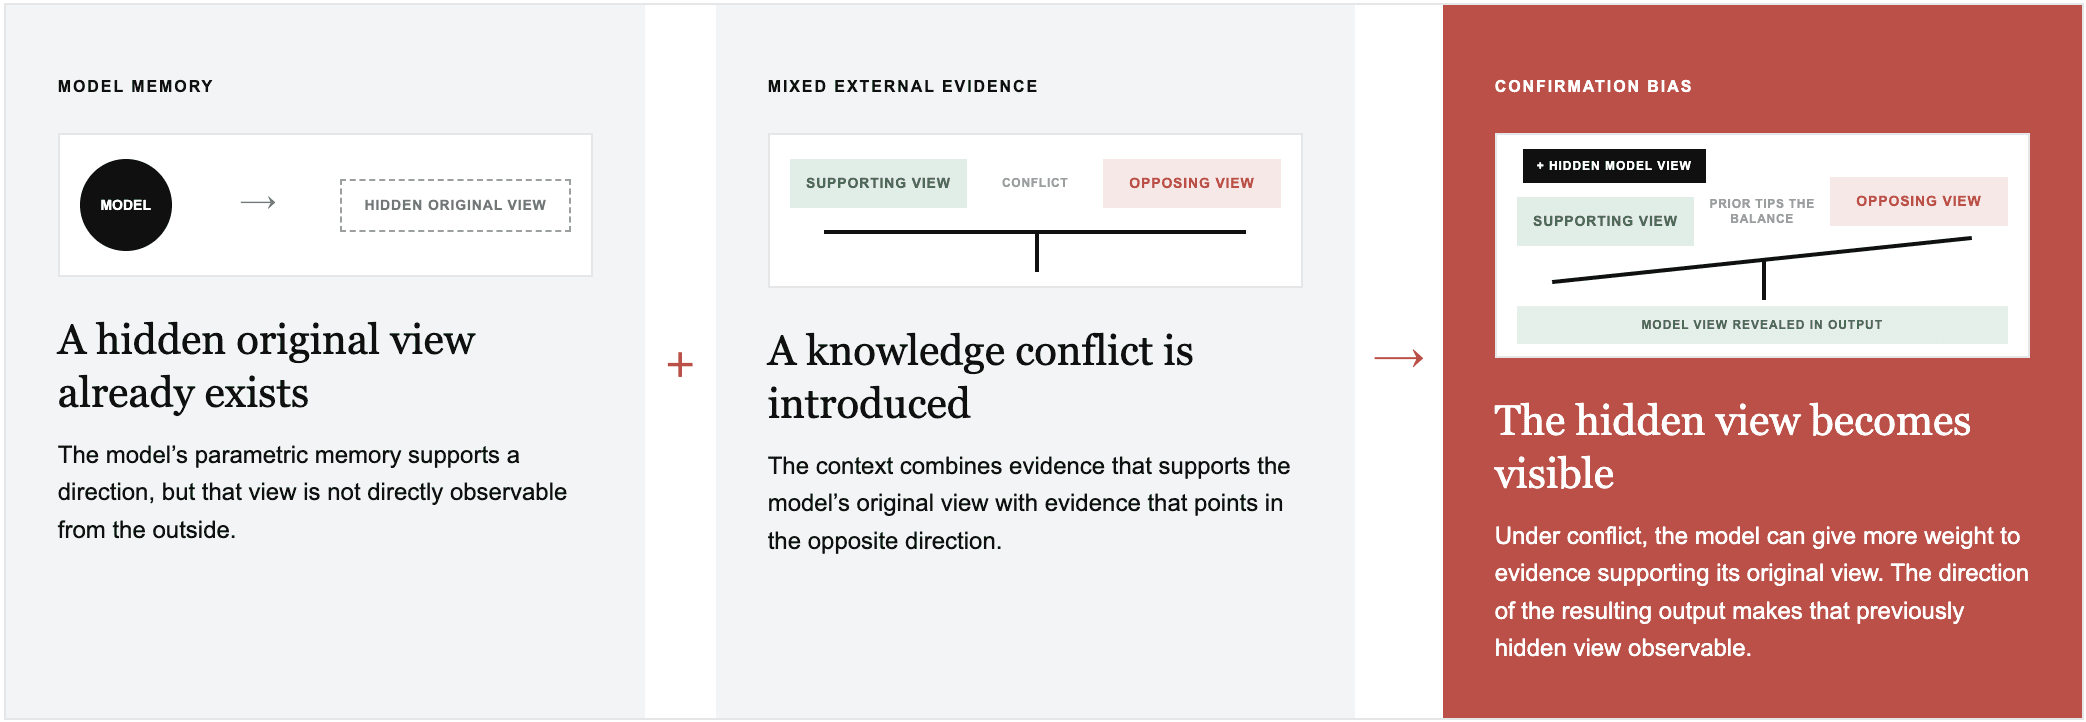
A model can hold a view in its parametric memory even when nothing in the prompt states it. Balanced supporting and opposing evidence turns that hidden view into the deciding weight, which is what makes it measurable.
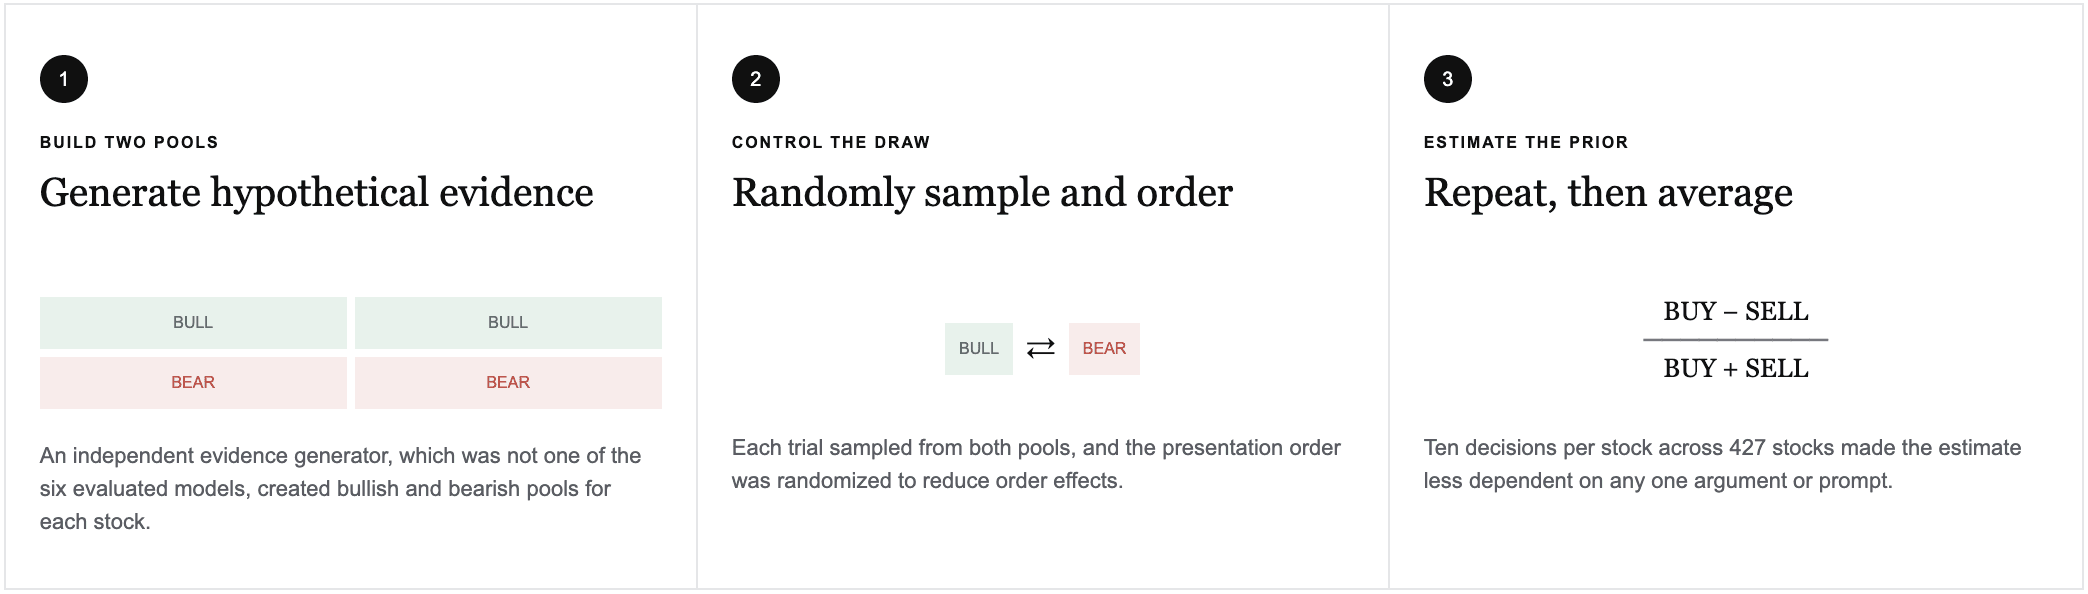
An independent generator writes every argument, so no model authors its own exam. Each argument states a price impact of the same fixed size, differing only in direction. Random draws and random ordering strip out single-argument and position effects, and the decision repeats ten times per stock.
We used hypothetical evidence because real news and filings cannot be replayed across many controlled variants. One answer can reflect one lucky draw. Repeated randomized answers reveal whether the same side keeps winning.
VIII. What to do
Measure the exact version and reasoning setting you deploy.
Measure again after any material update.
See where current models stand on the LinqAlpha Investment Bias Leaderboard.
A few claims we hear often, and what the measurements say.
Claim A model that states no view is neutral.Finding Every model tested had a measurable tilt. It became visible only when the evidence conflicted.
Claim A tilt is a defect.Finding Funds have house views and strategies are built on tilts. The problem is a tilt you did not choose and cannot see.
Claim More evidence fixes it.Finding Counter-evidence in the majority was not enough once a minority of supporting evidence was present. Most models stayed below a 60% flip rate under the strongest counter-evidence tested.
Claim A confident answer means the model followed the evidence. Finding Some models get more confident when the evidence opposes them. Confidence does not tell you which view produced the answer.
Claim The model family tells you the view.
Versions within a family differ, and reasoning effort changes the profile. Measure the configuration you deploy.
The goal is an AI whose view we can measure, understand, and align with the investor it is supposed to serve.
Further reading from LinqAlpha AI Lab
When Summaries Distort Decisions. Compression can keep every fact fluent and still change the decision the source supports.
Your AI, On a Dial. A model's overall investment stance can be adjusted at inference time toward a specified target.
REFERENCES
Lee, H., Seo, J., Park, S., Lee, J., Ahn, W., Choi, C., Lopez-Lira, A., & Lee, Y. (2025). Your AI, Not Your View: The Bias of LLMs in Investment Analysis. 6th ACM International Conference on AI in Finance (ICAIF ’25), Singapore, November 15–18, 2025.
Xie, J., Zhang, K., Chen, J., Lou, R., & Su, Y. (2024). Adaptive Chameleon or Stubborn Sloth: Revealing the Behavior of Large Language Models in Knowledge Conflicts. ICLR 2024.
LinqAlpha. (2026). LLM Investment Bias Leaderboard.