Benchmarks - Measurement

What Analysts Actually Ask: It's the Task, Not the Query

What Analysts Actually Ask: It's the Task, Not the Query

What Analysts Actually Ask: It's the Task, Not the Query

Benchmarks - Measurement

Suyeol Yun, Head of AI

Every AI benchmark scores a list of queries somebody wrote. But real queries almost never repeat. The unit that repeats is the task. We turned 33,453 anonymized customer queries into task signatures and clustered them into 501 task islands.

33,453
anonymized first-turn queries, every customer, two years
API & template traffic excluded
501
task islands after masking away ticker, language, market, phrasing
89% of queries land on an island
74
islands cover half of all clustered work
220 cover 80%
Disclaimer. The aggregated statistics in this post come from anonymized, aggregated usage analysis performed to improve the product. Individual queries shown in figures are not actual customer inputs; they are synthetic examples written for illustration, with company identifiers redacted. Before signatures are computed, all account and end-user-level identifiers are stripped and the query–customer mapping is severed.

I. The unit is wrong

Every benchmark is making a bet. You test a system on a few hundred questions, and you expect the score to tell you something about the thousands you didn’t test.

Nobody picks a question because it is unique. You pick it because it is representative, because a system that gets this one right will probably get the similar ones right too. Machine learning calls that family a task, and its definition always carries two things at once: which questions belong to the task, and how an answer to them gets scored.1

Here is the problem. Recent benchmarks from the major vendors in this market write a separate rubric for every question, rather than defining rubrics over tasks. That settles what counts as the same kind of work: two questions belong to the same task when they get the same rubric. So the rubrics already carry a taxonomy, and it says every question is its own kind of work.

Turn that same rule around and it becomes a definition. A task is a group of queries that share one rubric: an equivalence class under “graded the same way.”
FIG 1What a score is an average of
ONE TASK T = ( D, ρ ) ONE RUBRIC PER QUESTION the questions this task covers, one equivalence class [q] ∈ Q/∼ with density D q₁ ∼ q₂ ∼ q₃ one rubric grades all of them draw q₁, q₂, q₃ ∼ D 0.9 0.6 0.8 ρ( a(qi) ) 𝔼q∼D [ ρ( a(q) ) ] = 0.77 this average estimates how the system does across the whole task the class has one member [q] = {q} with density δq every draw returns q 0.8 𝔼q∼δ_q [ ρ( a(q) ) ] = ρ( a(q) ) measures this one question exactly, and generalizes to nothing q ∼ q′ ⇔ ρq = ρq′ two questions are related when the benchmark hands them the same rubric Q every query ever asked Q/∼ the quotient set: Q grouped by ∼, all the tasks at once [q] the equivalence class of q: by definition, a task a(·)the system being tested ρq the rubric assigned to q ρ that rubric, scoring an answer D how a task’s queries are spread δq all the weight on the single query q, so every draw returns q. A point mass.
Each dot is a question in one equivalence class, and the rings show how far the class reaches. A benchmark draws a few, scores them with the class’s rubric, and reports the expectation. On the right the class has collapsed to a single point, so the expectation reduces to that one question’s score.

II. Deleting everything that doesn't change the work

The obstacle to drawing those groups is that queries never repeat: across those queries, 88% are one-of-a-kind even after normalization. You cannot tabulate the probability of a query you will never see twice. Prediction requires recurrence, and the unit that recurs is not the query. It is the task.

So we compute, for every query, its task signature: what remains when you delete everything that doesn't change the work the system must do. Ticker, language, market, dates, phrasing: deleted. The verb, the artifact requested, the evidence source, the qualifiers that change the job: kept. Two queries get the same signature exactly when they ask for the same work: same routing, same tools, same grading rubric. Cluster the signatures and the whole history of usage collapses into task islands: recurring families of work.

FIG 2Three languages, three tickers, one task
Illustrative queries · synthetic
Task signature
“[company A] numbers are out. how do they stack up against consensus, and does the selloff make sense?”English · Search
“Les résultats annuels de [company B] sont-ils meilleurs ou moins bons que prévu ? Fais-moi un petit résumé.”French · Search
“[company C] 이번 실적 발표 요약해줄래? 컨센서스 대비 잘 나왔는지, 가이던스는 어떤지 궁금해.”Korean · Analytics
assess just-released {PERIOD} results and guidance of {TICKER}: beat/miss vs expectations and implied stock reaction
The signature is invariant: change the language, the ticker, the market, or the phrasing, and it does not move. It is also sufficient: it still carries everything needed to route and grade the work.2

III. The map

Clustering the signatures yields 501 named task islands covering 89% of the 33,453 queries. These are the groups drawn solid: a measured, monitorable distribution over the kinds of work that exist. Some of what it shows, nobody would have put in an editorial benchmark: explaining sudden price drops and explaining rallies are distinct tasks customers ask differently; extracting interest-rate sensitivity tables from bank filings is a 227-query profession of its own; and 327 queries are customers probing what the product can do: a product-gap signal masquerading as usage.
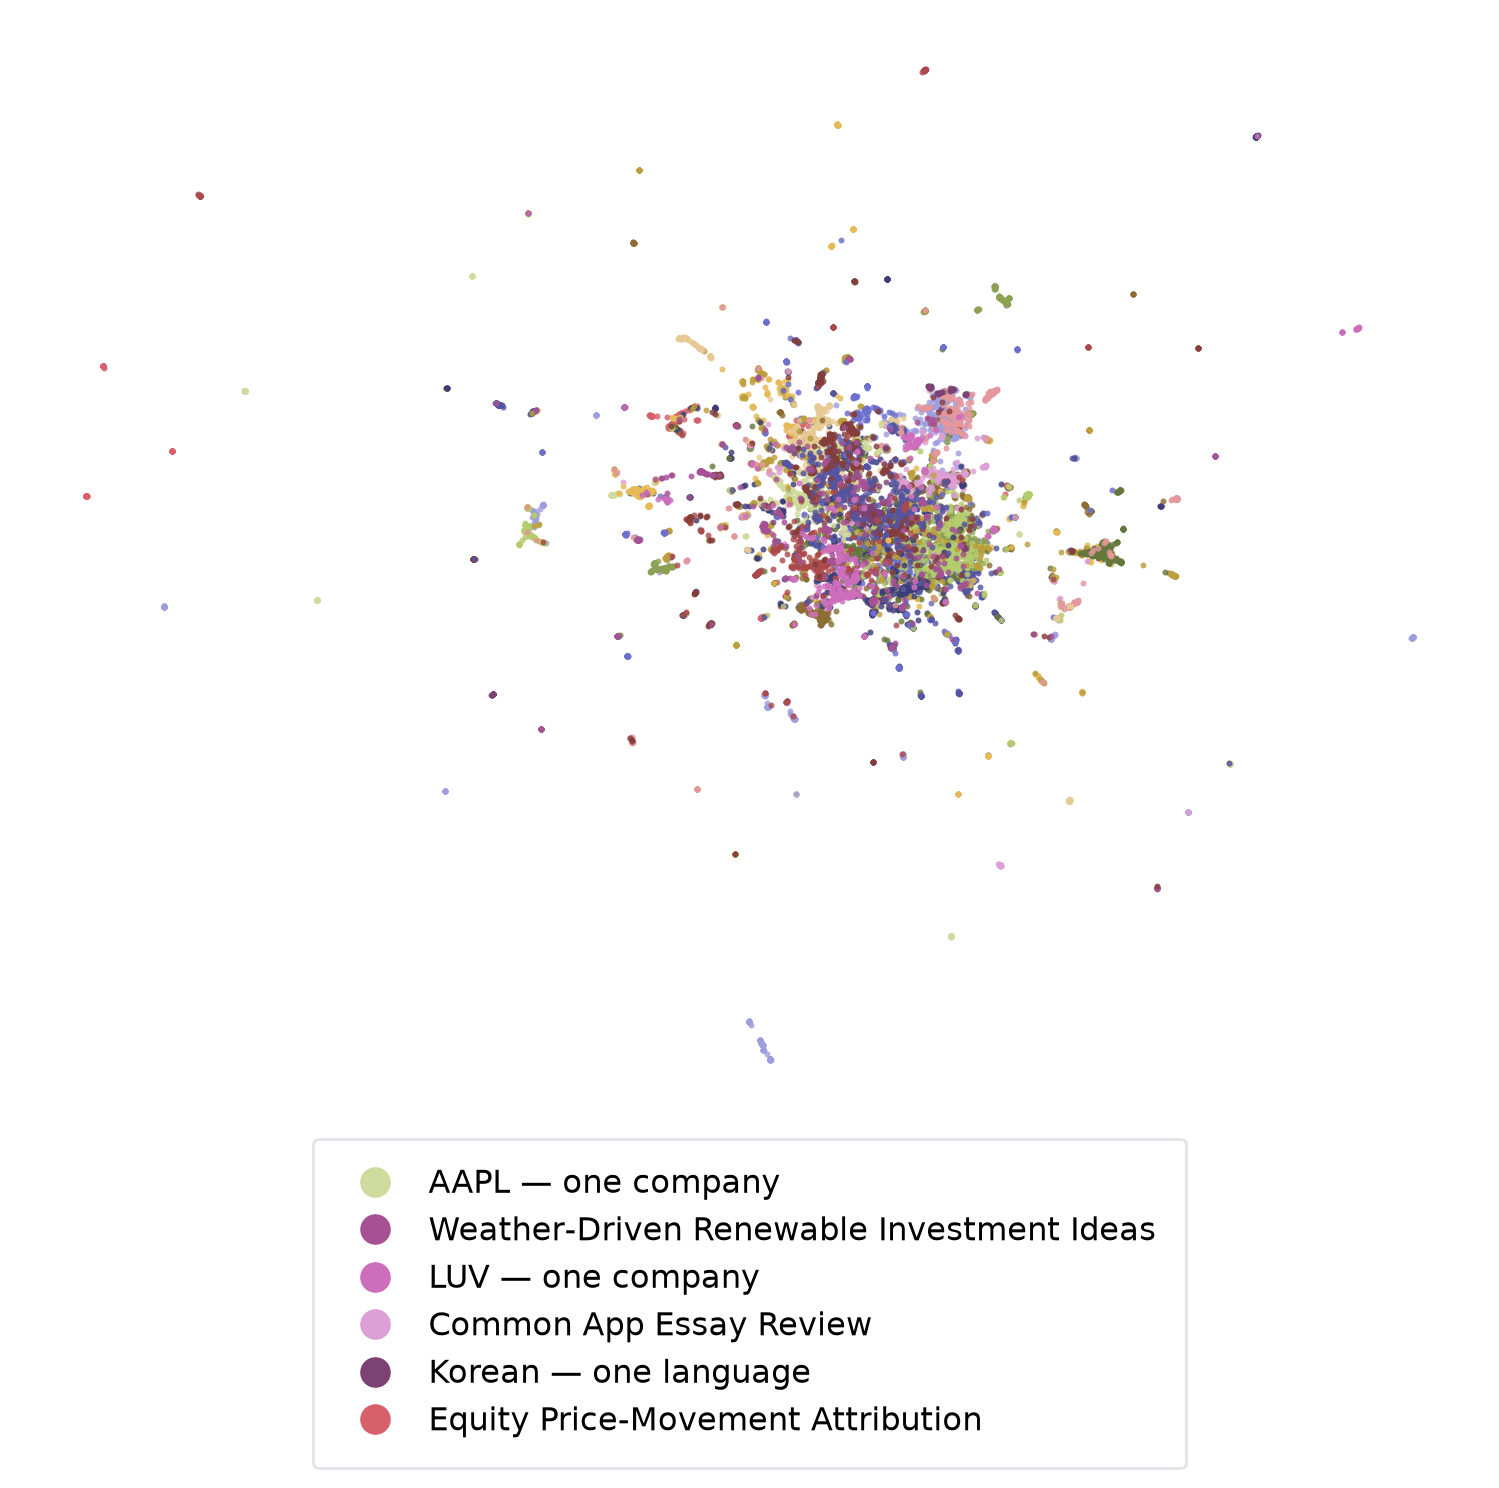
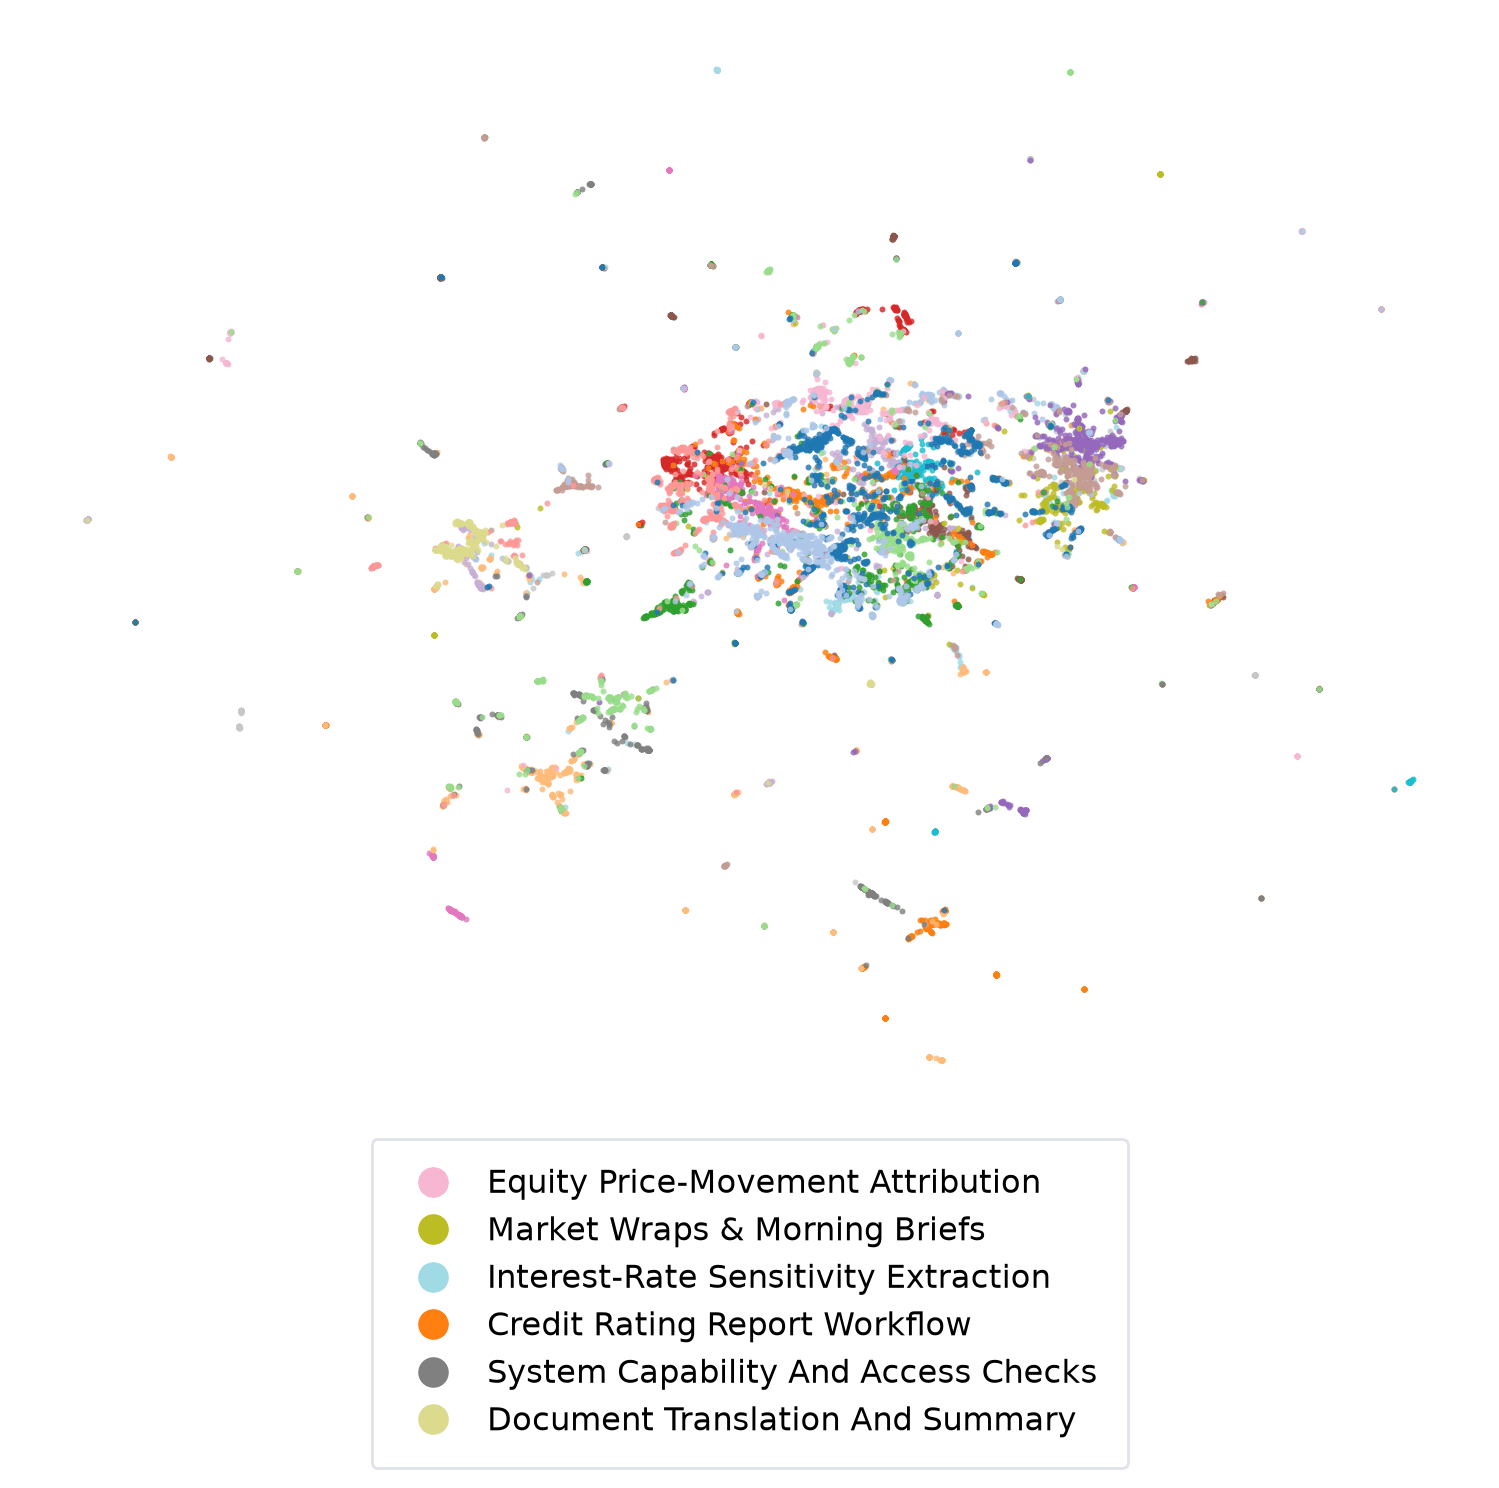
FIG 3Same queries, two embeddings: tasks become separable clusters only in signature space
3D map of raw-query embeddings: one large gray mass (English) with a green Korean arm and blue Chinese and purple Japanese pockets
✗ Embed the query text. One gray English continent; the green arm is Korean, blue Chinese, purple Japanese. “Similar” means same language, same phrasing. A benchmark sampled from this geometry measures wording.
✓ what a benchmark should sample from
3D map of task-signature embeddings: hundreds of small, distinctly colored task islands
✓ Embed the task signature. The same queries reorganize into hundreds of task islands, each color one recurring kind of work, mixing languages, tickers and firms freely. A benchmark sampled from this geometry measures the job.
FIG 4The largest task islands, by measured demand
AI Investment & Screening775
Revenue & Metric Retrieval741
Segment & Revenue Attribution629
Valuation Modeling & Comparisons522
Equity Price-Movement Attribution467
Macro Event → Company Impact402
Market Wraps & Morning Briefs389
Company News Updates & Summaries382
Investor Relations & Meeting Prep381
Macro & Commodity Data Compilation376
M&A, Stakes & Deal Details350
System Capability & Access Checks327
Quarterly Results vs Consensus256
Interest-Rate Sensitivity Extraction227
487 more islands, down to micro-families of ten queries
Island names and demand counts are aggregated statistics over two years of usage; no individual queries are shown.
FIG 5One example query, asked to both maps: “find me similar queries”
The query “what's behind the jump in European bank stocks today?”
Raw-text map answers…
0.74  “european banks jumping again today, what's behind the move?”
en · near-duplicate phrasing
0.71  “can you explain today's move in EU bank shares?”
en · near-duplicate phrasing
0.71  “european banking sector: today's move”
en · near-duplicate phrasing
0.71  “/stock-move banks EU | anything behind the euro bank strength this week?”
en · near-duplicate phrasing
✗ Four rephrasings of itself: same language, same sector, same wording. A raw-text map measures phrasing.
Task-signature map answers…✓ what a benchmark should sample
0.84  “Why did US regional bank stocks rally yesterday?”
en · different market
0.81  “요즘 일본 은행주가 왜 이렇게 강세야?” (why are Japanese bank stocks so strong lately?)
ko · different market
0.80  “what's behind the jump in Brazilian utility stocks this week?”
en · different market
0.79  “why did insurance stocks sell off after the rate decision?”
en · different sector
✓ The same job, everywhere it occurs: different markets, two languages, one task: explain why a sector moved.
All queries in this figure are synthetic illustrations; similarity values are representative of the underlying (non-public) measurement.

IV. Reading the field through the map

With the map in hand, a question that has never been answerable becomes a routine computation: take any published benchmark's task list and place each item on the map. Coverage stops being a claim and becomes a number: which islands a benchmark touches, and how much real demand those islands carry.

The same map runs our own shop. With the tasks written down, coverage is something we can check, so nothing customers ask slips through unnoticed. We score the system island by island instead of on whichever queries happened to be handy, and improvements work the same way. A fix made at the task level reaches everyone who asks that kind of question.

FIG 6How much of the LinqAlpha query universe each public benchmark touches
Public filings-QA benchmark 2023filings Q&A · retrieval-centric, single-answer grading~17%
mostly lands on Revenue & Metric Retrieval, Segment & Revenue Attribution, Interest-Rate Sensitivity Extraction: the filings-lookup core.
never touches anything time-sensitive: Equity Price-Movement Attribution, Market Wraps, Meeting Prep.
Expert-authored hard-task benchmark 2026frontier-difficulty tasks · model-focused, harness-blind~20%
mostly lands on Valuation Modeling & Comparisons and deep single-company analysis: the hard tail experts like to write.
never touches the high-traffic head: Revenue & Metric Retrieval, Segment & Revenue Attribution, Company News Updates.
Commercial agent benchmark 2026~230 released queries · per-query hand-weighted rubrics · LLM judge · leaderboard with error bars~34%
mostly lands on the research core: Quarterly Results vs Consensus, valuation comparisons, filings extraction.
never touches the live-desk islands: Market Wraps, Investor Relations & Meeting Prep, Equity Price-Movement Attribution.
LinqAlpha Benchmarkdemand-weighted stratified sample over the islands80%
deliberate a demand-weighted sample over the 220 largest islands. On the recorded-query base this is 71%: the 20% island tail and the 11% unclustered residue are named lists, not blind spots.
 the share of the LinqAlpha query universe the benchmark’s tasks touch (base: the 89% of our 33,453 recorded queries that land on an island) the share it never touches

V. What the map does not give you

The map hands a benchmark two things it never had: which tasks to test, and how much each one actually comes up. Scores can then be reported island by island, so a low number says where a system fails.

What it does not give you is the rubric. An island tells you which questions belong together. It does not tell you how to grade them.

And a rubric written once goes stale. One results release turns “not yet computable” into an exact reported figure overnight, and the same facts have to support different conclusions for an equity desk and a credit desk. A hand-picked query list grades a desk that does not exist. A hand-frozen rubric grades a market that no longer exists.

So we make the same move again, one level up. This post replaced hand-authored query lists with the unit of demand that recurs, the task. FinAutoRubric, our companion work, replaces hand-authored per-item rubrics with the unit of grading that recurs: the expert principle. Ten reusable principles, validated once by experts, are instantiated into a context-specific rubric for each task, bound to its entities, its information cutoff and its domain lens, then checked by an automatic refinement loop before acceptance.

Notes

  1. The pairing is standard across three decades and three subfields. Mitchell, T. M. (1997), Machine Learning, McGraw-Hill, §1.1, defines learning with respect to “a class of tasks T and performance measure P”: the class and its measure named together. Finn, C., Abbeel, P., & Levine, S. (2017), Model-Agnostic Meta-Learning for Fast Adaptation of Deep Networks, ICML (arXiv:1703.03400), §2.1, writes a task as 𝒯 = {ℒ, q(x₁), q(xt+1|xt,at), H}, with the loss ℒ and the distribution q as entries of the same object. Zhai, X., Puigcerver, J., Kolesnikov, A., et al. (2019), A Large-scale Study of Representation Learning with the Visual Task Adaptation Benchmark (arXiv:1910.04867), §2, describes a task as “a tuple containing a task-specific dataset distribution DT and evaluation procedure.” ↩ back
  2. The machinery, for readers who want it. Write S for the set of possible signatures (the shapes a question can take once the ticker, language, date and phrasing are gone), σ : Q → S for the map taking a query to its signature, and ρ̄ : S → R for the map taking a signature to the rubric template that grades that shape of question; the ticker and date re-enter as parameters when the template is instantiated. Two conditions: (i) ρq = ρ̄(σ(q)): which rubric a query gets depends on the query only through its signature; and (ii) s ≠ s′ ⇒ ρ̄(s) ≠ ρ̄(s′): distinct signatures receive distinct rubrics. Together they give q ∼ q′ ⇔ σ(q) = σ(q′): same signature exactly when same rubric. In partition terms, the rubric assignment partitions Q (FIG 1 called the cells tasks), and the signature partitions Q too. Condition (i) says the signature partition refines the rubric partition; condition (ii) says the refinement also runs the other way. Two partitions that refine each other are the same partition, so grouping by signature is grouping by rubric. Signatures are cheap to compute for all 33,453 queries; rubrics are not. ↩ back